2 Cost of hosting world cup
Let’s start by loading the libraries that we’ll utilize in our analysis
#web scrapping
library(rvest)
#everything tidy?
library(tidyverse)
#handling spatial-data
library(rnaturalearth)
library(rnaturalearthdata)
library(sf)
library(ggflags)
library(ggspatial)
library(giscoR)
library(rasterpic)
library(countrycode)
#adding flags in ggplot
library(ggimage)
#Visually explore data tables
library(visdat)
#fit text within a defined area
library(ggfittext)
#set the default ggplot theme
theme_set(cowplot::theme_cowplot())
#get image
wc_img <- here::here("images/wc12.png")
#define function to control transparency

transparent_0.1 <- function(img) {
  magick::image_fx(img, expression = glue::glue("0.1*a"), channel = "alpha")
}
transparent_0.2 <- function(img) {
  magick::image_fx(img, expression = glue::glue("0.2*a"), channel = "alpha")
}
# get flags form this repo
flagrepo <- "https://raw.githubusercontent.com/hjnilsson/country-flags/master/png250px/"
#
# Extract the amount of money
url_2 <- "https://en.wikipedia.org/wiki/Economics_of_the_FIFA_World_Cup"
tbls_lst_2 <- url_2 %>%
read_html %>%
html_table()
#
df_4 <- tbls_lst_2[[2]] %>%
janitor::clean_names() %>%
mutate(host = str_replace(host, "/\\s", "-")) %>%
extract(host, c("country","year"), "([A-Z-]+) (\\([0-9]+\\))") %>%
separate_rows(country,sep = "-") %>%
mutate(year = parse_number(year),
#x = strex::str_first_currency(general_cost)[[4]],
x = parse_number(general_cost),
y = ifelse(str_detect(general_cost, "million"),x/1000,x))
df_4$iso2 <- countrycode(df_4$country, "ioc", "iso2c")ggplot()+
geom_col(data = df_4 %>% distinct(year, y),
aes(year, y),
fill = "grey90", color = "black", size = 1)+
geom_text(data = df_4 %>% distinct(year, y),
aes(year, y, label = y),
size = 5, nudge_y = 8)+
scale_y_continuous(breaks = c(1,10,100,200))+
labs(y = "Billion $")## Warning: Using `size` aesthetic for lines was deprecated in ggplot2 3.4.0.
## ℹ Please use `linewidth` instead.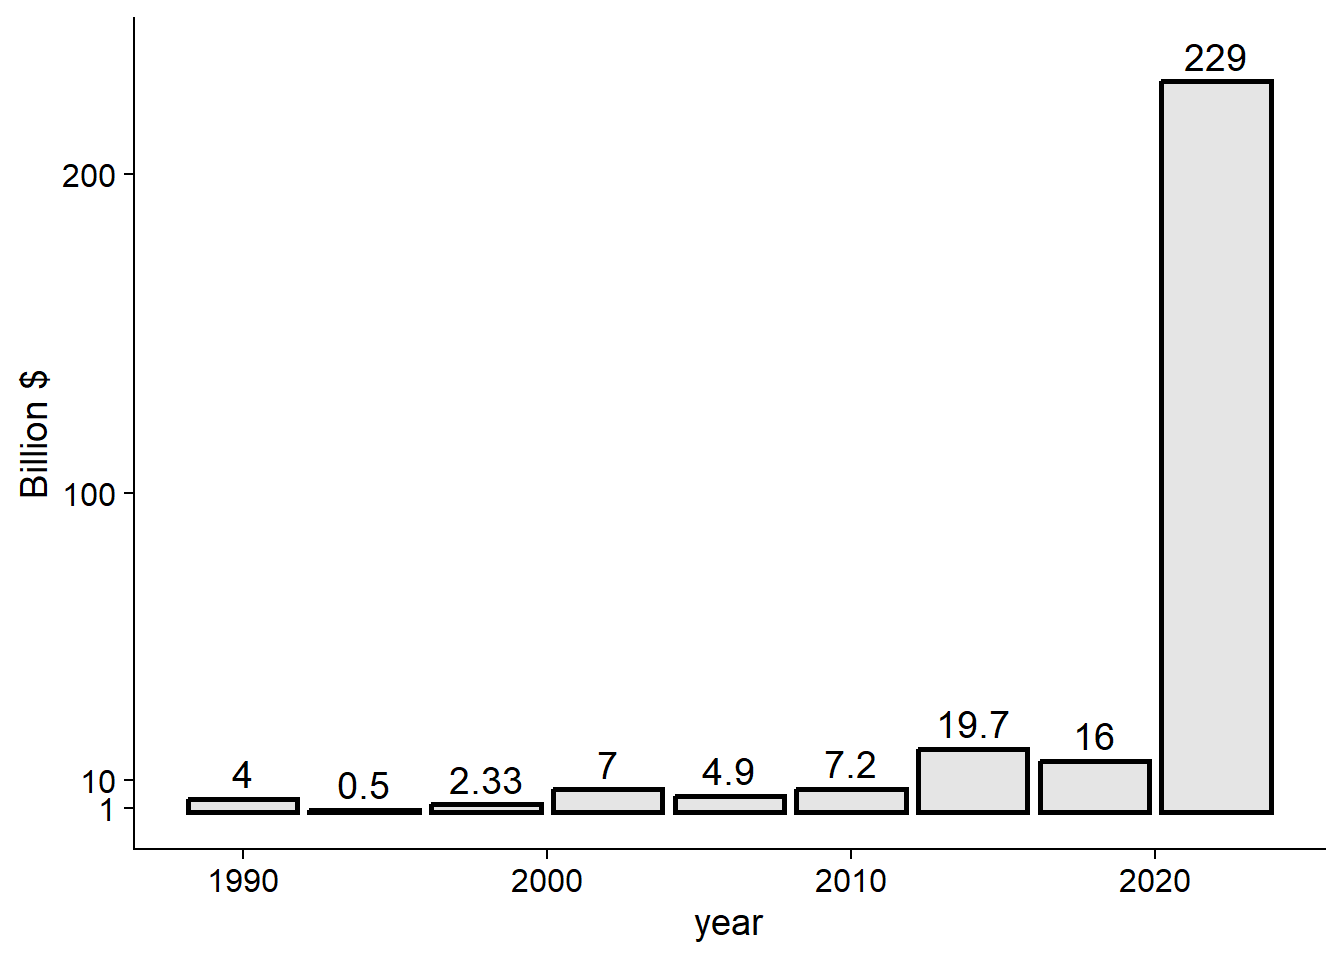
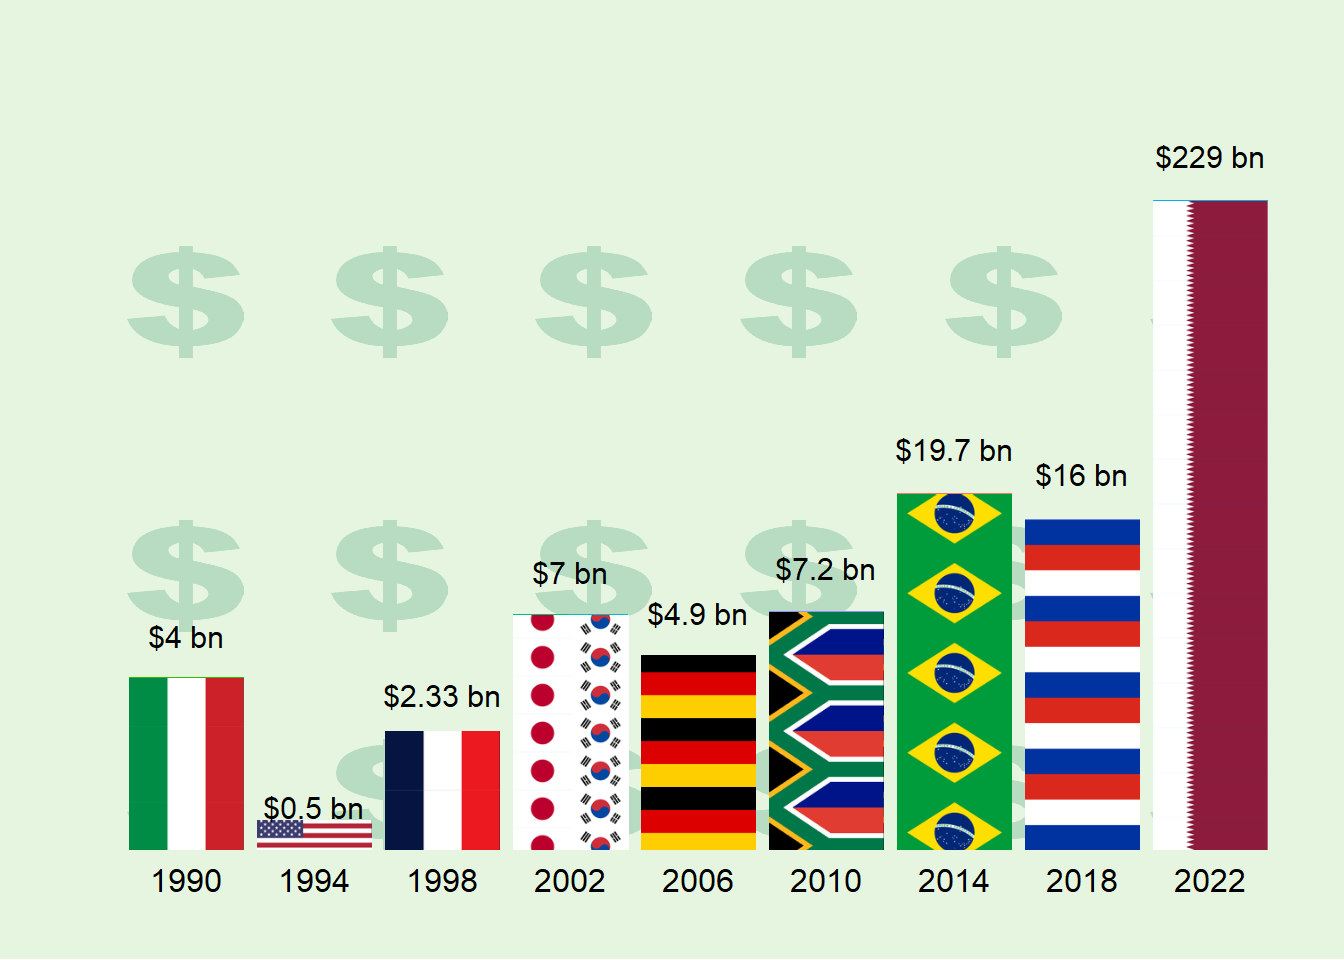
ggplot()+
  geom_col(data = df_4 %>% distinct(year, y),
           aes(year, y))+
  geom_text(data = df_4 %>% distinct(year, y) %>% mutate(y2 =y, y = glue::glue("${y} bn")),
            aes(year, y2, label = y),
            size = 4, nudge_y = 20)+
  ggimage::geom_flag(data = df_4 %>%
                       filter(!country %in% c("JPN", "KOR")),
                     aes(year, y+8, image = iso2),
                     size = 0.07)+
  ggimage::geom_flag(data = df_4 %>%
                       filter(country %in% c("JPN", "KOR")) %>%
                       mutate(year=ifelse(str_detect(country, "JPN"), year+1.5, year)),
                     aes(year-0.7, y+8, image = iso2),
                     size = 0.05)+
   ggpattern::geom_col_pattern(data = df_4 %>% distinct(year,  y),
                               aes(year, y),
                               pattern_filename = I("images/Gold-Dollar-Sign-PNG-HD.png"),
                               pattern = 'image',
                               pattern_type = 'tile',
                               pattern_scale = -1,
                               fill = "#a1d99b"
                               )+
    ggimage::geom_image(data = data.frame(x = 1995, y = 120),
                      aes(x,y),
                      image = wc_img,image_fun = transparent_0.2,
                      size = 1.2)+
      scale_x_continuous(breaks = unique(df_4$year))+
  scale_y_continuous(breaks = c(1,10,100,200))+
  labs(y = "", x = "")+
    theme(plot.background = element_rect(fill =  "#e5f5e0"),
        panel.background = element_rect(fill =  "#e5f5e0"),
        panel.grid.major = element_line(colour = "#e5f5e0"),
        axis.line = element_blank(),
        axis.ticks = element_blank(),
        axis.text.y = element_blank())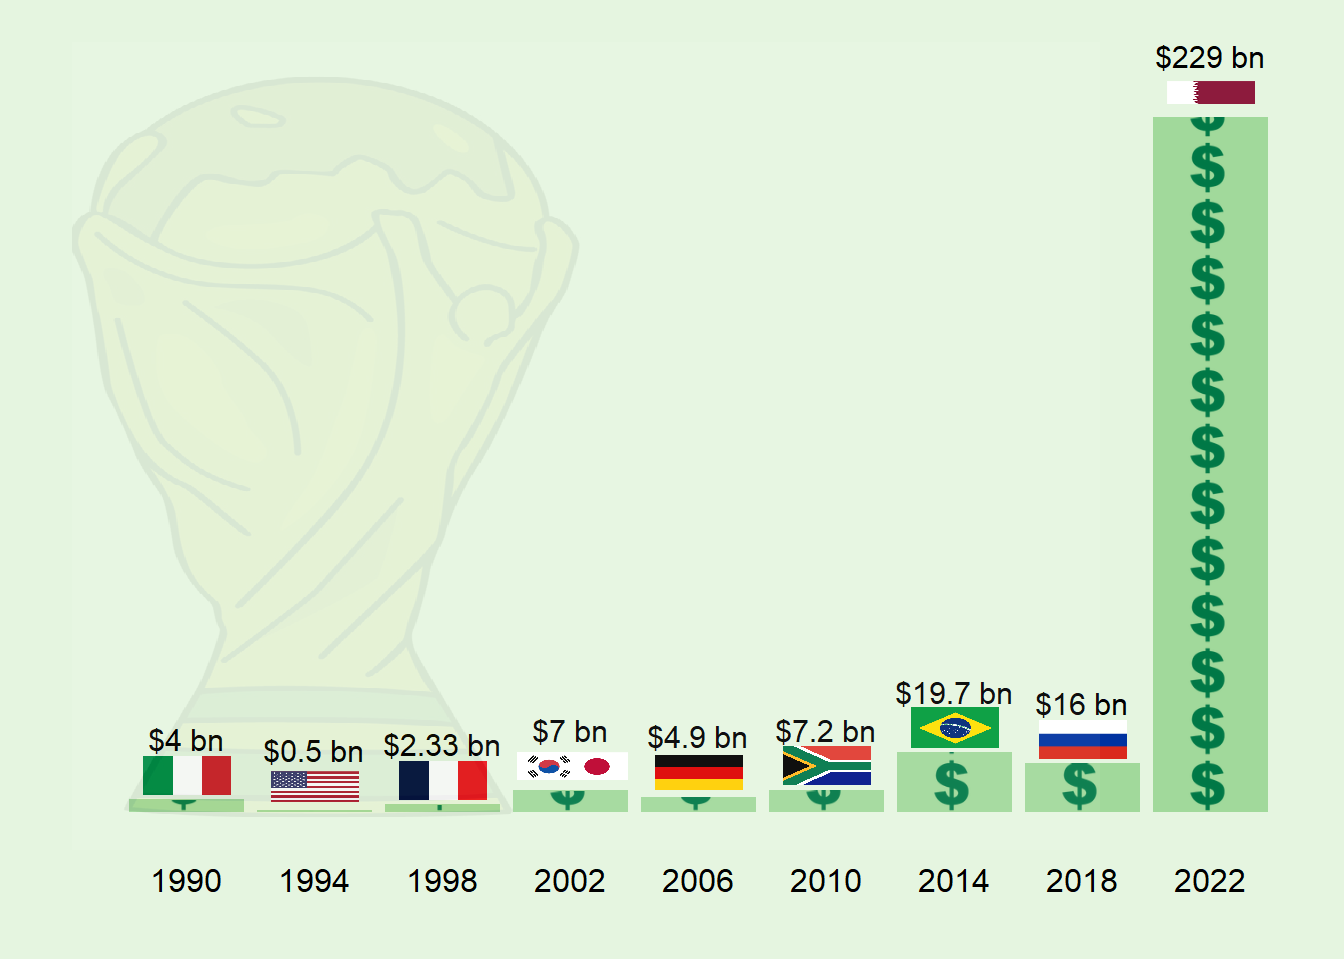
flags <- c()
# Loop and add
for (iso in df_4$iso2) {
  # Download pic and plot
  imgurl <- paste0(flagrepo, tolower(iso), ".png")
  tmpfile <- tempfile(fileext = ".png")
  download.file(imgurl, tmpfile, quiet = TRUE, mode = "wb")

  flags <- c(flags, tmpfile)
}ggplot()+
ggimage::geom_image(data = data.frame(x = 1995, y = 30),
aes(x,y),
image = wc_img,
image_fun = transparent_0.1,
size = 1.2)+
ggimage::geom_image(data = df_4 %>%
distinct(year, y) %>%
mutate(y2 = y+(y*0.85)) ,
aes(year, y2),
size = df_4 %>% distinct(year, y) %>% mutate(x = ceiling(log10(y*10))/10) %>% pull(x),
image = "images/Gold-Dollar-Sign-PNG-HD.png",
image_fun = transparent_0.2)+
ggpattern::geom_col_pattern(data = df_4 ,
aes(year, y, fill = country),
position = position_dodge(),
pattern_gravity = I("West"),
pattern_filename = I(flags),
pattern = 'image',
pattern_type = 'tile',
pattern_scale = -1,
show.legend = FALSE)+
geom_text(data = df_4 %>%
distinct(year, y) %>%
mutate(y2 = y+(y*0.45),
y = glue::glue("${y} bn")),
aes(year, y2, label = y),
size = 4)+
geom_text(data = df_4%>%
arrange(country) %>%
group_by(year) %>%
summarise(iso2 = paste(iso2, collapse = "-")),
aes(year, label = iso2),
y = -0.07,
size = 4)+
scale_y_continuous(breaks = c(1,10,100,200),
trans = scales::pseudo_log_trans(base = 10),
expand = expansion(add = c(0.2,0.5))
)+
scale_x_continuous(breaks = unique(df_4$year))+
labs(y = "", x = "")+
theme(plot.background = element_rect(fill = "#e5f5e0"),
panel.background = element_rect(fill = "#e5f5e0"),
panel.grid.major = element_line(colour = "#e5f5e0"),
axis.line = element_blank(),
axis.ticks = element_blank(),
axis.text.y = element_blank(),
axis.text.x = element_text(size = 15))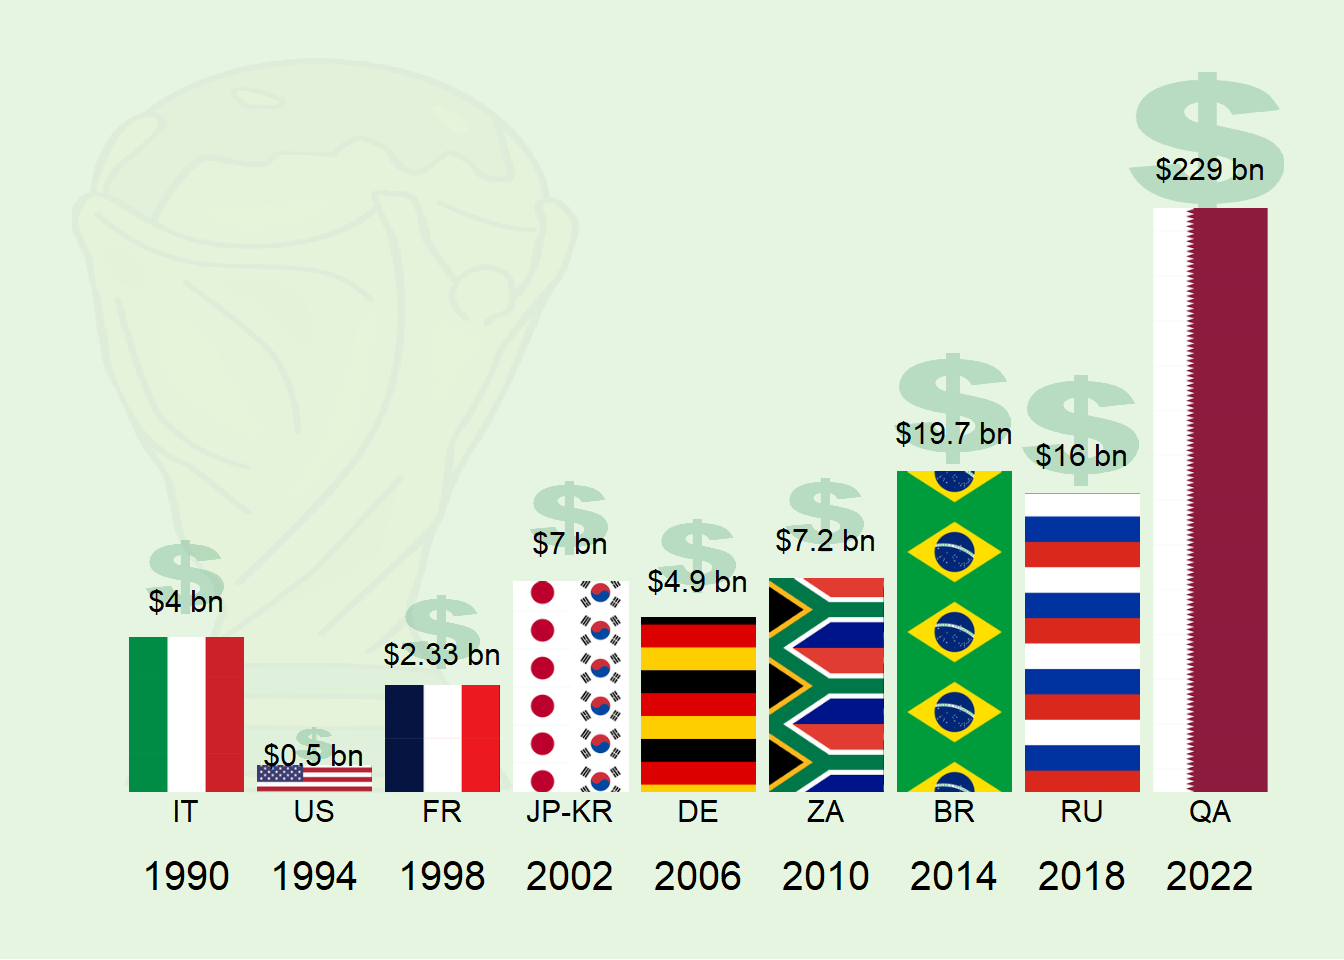
ggplot()+
    ggimage::geom_image(data = expand_grid(x = c(seq(1990, 2022,length.out = 6)),
                                           y = c(1, 10, 100)),
                      aes(x,y),
                      image = "images/Gold-Dollar-Sign-PNG-HD.png",image_fun = transparent_0.2,
                      size = 0.3)+
 ggpattern::geom_col_pattern(data = df_4 ,
                             aes(year, y, fill = country),
                             position = position_dodge(),
                             pattern_gravity = I("West"),
                             pattern_filename = I(flags),
                             pattern = 'image',
                             pattern_type = 'tile',
                             pattern_scale = -1,
                             show.legend = FALSE)+
  scale_y_continuous(breaks = c(1,10,100,200),
                     trans = scales::pseudo_log_trans(base = 10),
                     expand = expansion(add = c(NA,0.5))
                     )+
    scale_x_continuous(breaks = unique(df_4$year))+
  geom_text(data = df_4 %>% distinct(year, y) %>% mutate(y2 = y+(y*0.45), y = glue::glue("${y} bn")),
            aes(year, y2, label = y),
            size = 4)+
    geom_text(data = df_4%>%
                arrange(country) %>%
                group_by(year) %>%
                summarise(iso2 = paste(iso2, collapse = "-")),
            aes(year, label = iso2),
            y = -0.07,
            size = 4)+
  labs(y = "", x = "")+
    theme(plot.background = element_rect(fill =  "#e5f5e0"),
        panel.background = element_rect(fill =  "#e5f5e0"),
        panel.grid.major = element_line(colour = "#e5f5e0"),
        axis.line = element_blank(),
        axis.ticks = element_blank(),
        axis.text.y = element_blank())